
PUBLICATION: 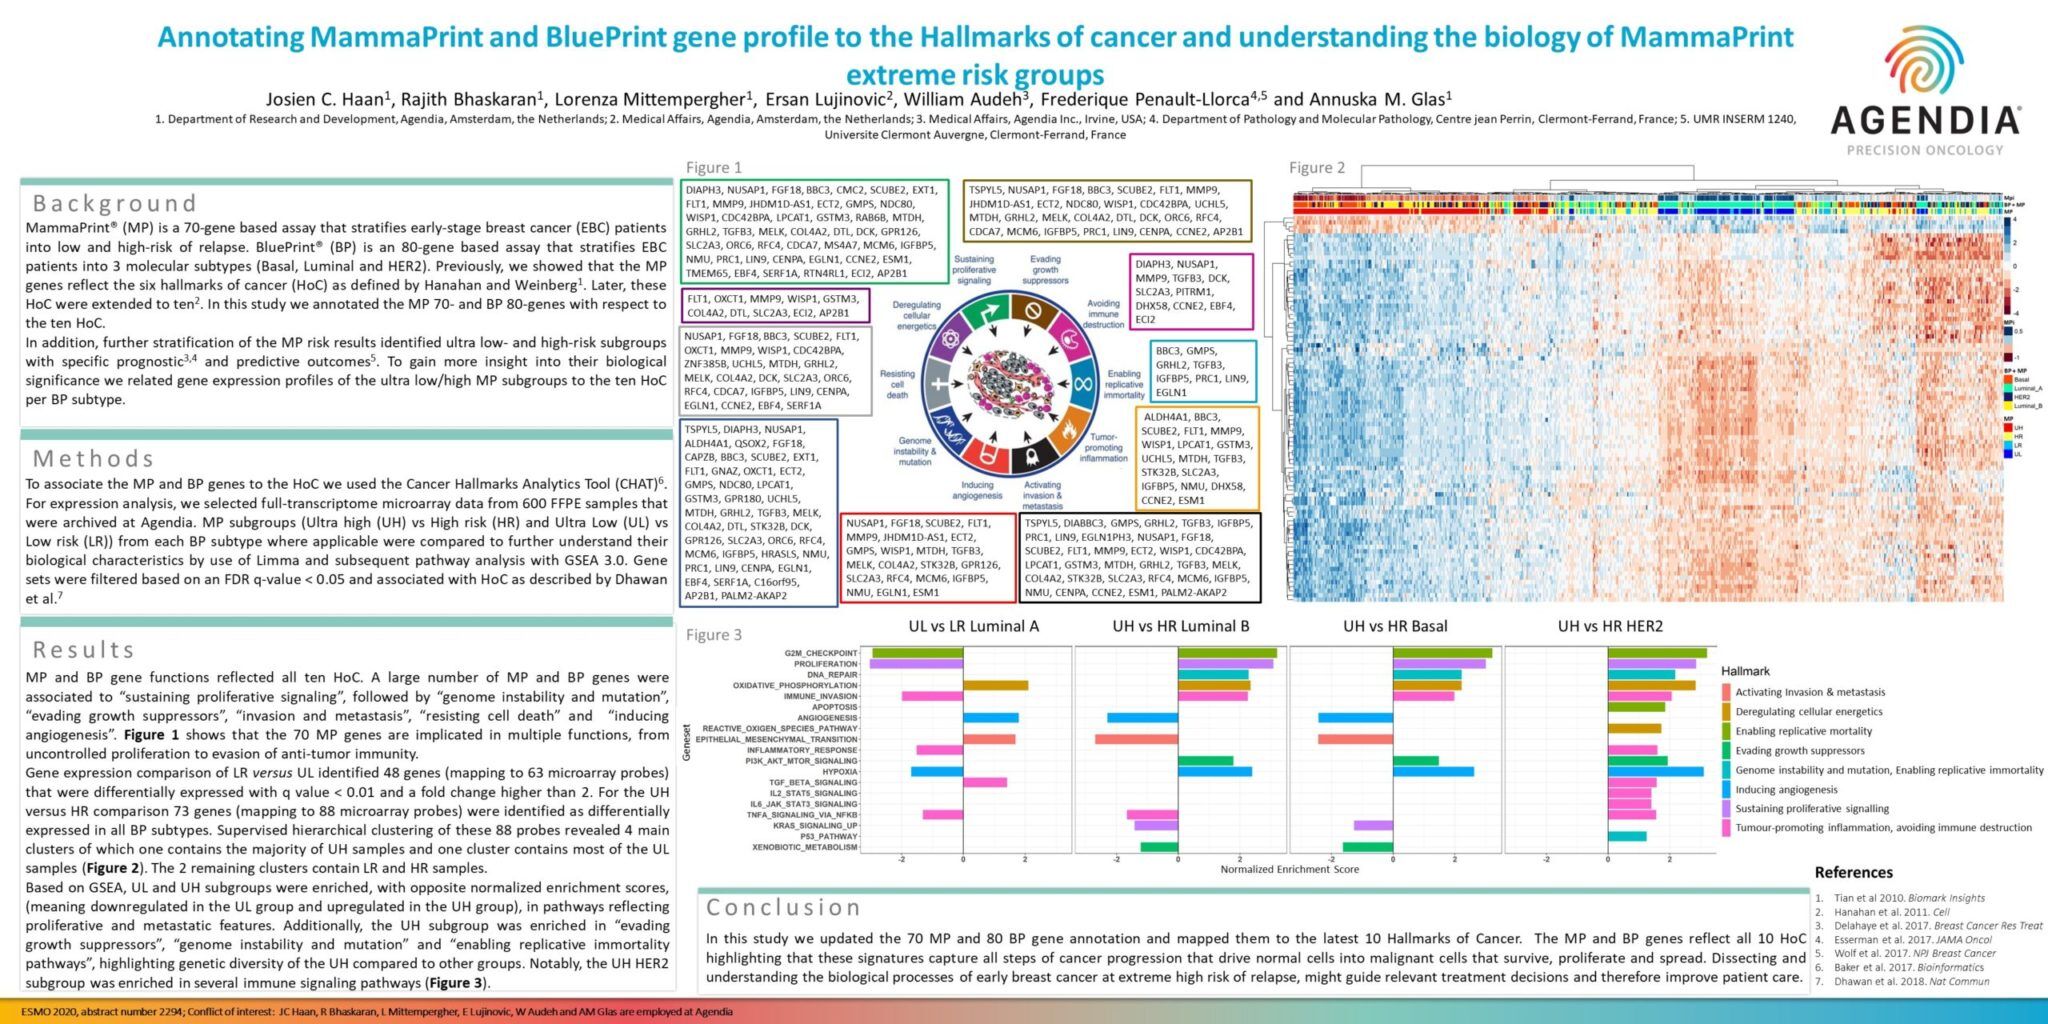
ESMO 2020
AUTHORS:
Josien C. Haan, Rajith Bhaskaran, Lorenza Mittempergher, Ersan Lujinovic, William Audeh, Frederique Penault-Llorca and Annuska M. Glas
Background:
MammaPrint® (MP) is a 70-gene based assay that stratifies early-stage breast cancer (EBC) patients into low and high-risk of relapse. BluePrint® (BP) is an 80-gene based assay that stratifies EBC patients into 3 molecular subtypes (Basal, Luminal and HER2). Previously, we showed that the MP genes reflect the six hallmarks of cancer (HoC) as defined by Hanahan and Weinberg [1]. Later, these HoC were extended to ten [2]. In this study we annotated the MP 70- and BP 80-genes with respect to the ten HoC.
In addition, further stratification of the MP risk results identified ultra low- and high-risk subgroups with specific prognostic [3,4] and predictive outcomes [5]. To gain more insight into their biological significance we related gene expression profiles of the ultra low/high MP subgroups to the ten HoC per BP subtype.
Methods
To associate the MP and BP genes to the HoC we used the Cancer Hallmarks Analytics Tool (CHAT)[6]. For expression analysis, we selected full-transcriptome microarray data from 600 FFPE samples that were archived at Agendia. MP subgroups (Ultra high (UH) vs High risk (HR) and Ultra Low (UL) vs Low risk (LR)) from each BP subtype where applicable were compared to further understand their biological characteristics by use of Limma and subsequent pathway analysis with GSEA 3.0. Gene sets were filtered based on an FDR q-value < 0.05 and associated with HoC as described by Dhawan et al.[7]
Results
MP and BP gene functions reflected all ten HoC. A large number of MP and BP genes were associated to “sustaining proliferative signaling”, followed by “genome instability and mutation”, “evading growth suppressors”, “invasion and metastasis”, “resisting cell death” and “inducing angiogenesis”. Figure 1 shows that the 70 MP genes are implicated in multiple functions, from uncontrolled proliferation to evasion of anti-tumor immunity.
Gene expression comparison of LR versus UL identified 48 genes (mapping to 63 microarray probes) that were differentially expressed with q value < 0.01 and a fold change higher than 2. For the UH versus HR comparison 73 genes (mapping to 88 microarray probes) were identified as differentially expressed in all BP subtypes. Supervised hierarchical clustering of these 88 probes revealed 4 main clusters of which one contains the majority of UH samples and one cluster contains most of the UL samples (Figure 2). The 2 remaining clusters contain LR and HR samples.
Based on GSEA, UL and UH subgroups were enriched, with opposite normalized enrichment scores,(meaning downregulated in the UL group and upregulated in the UH group), in pathways reflecting proliferative and metastatic features. Additionally, the UH subgroup was enriched in “evading growth suppressors”, “genome instability and mutation” and “enabling replicative immortality pathways”, highlighting genetic diversity of the UH compared to other groups. Notably, the UH HER2 subgroup was enriched in several immune signaling pathways (Figure 3).
Conclusion
In this study we updated the 70 MP and 80 BP gene annotation and mapped them to the latest 10 Hallmarks of Cancer. The MP and BP genes reflect all 10 HoC highlighting that these signatures capture all steps of cancer progression that drive normal cells into malignant cells that survive, proliferate and spread. Dissecting and understanding the biological processes of early breast cancer at extreme high risk of relapse, might guide relevant treatment decisions and therefore improve patient care.


